Interactive Visual Analytics
Navigate through multiple perspectives of Nigeria's debt landscape. Use the interactive controls to filter by time period, debt type, or creditor. Click on any visualization to dive deeper into the underlying data patterns.
Key Insights Available
Discover what the data reveals about Nigeria's fiscal trajectory
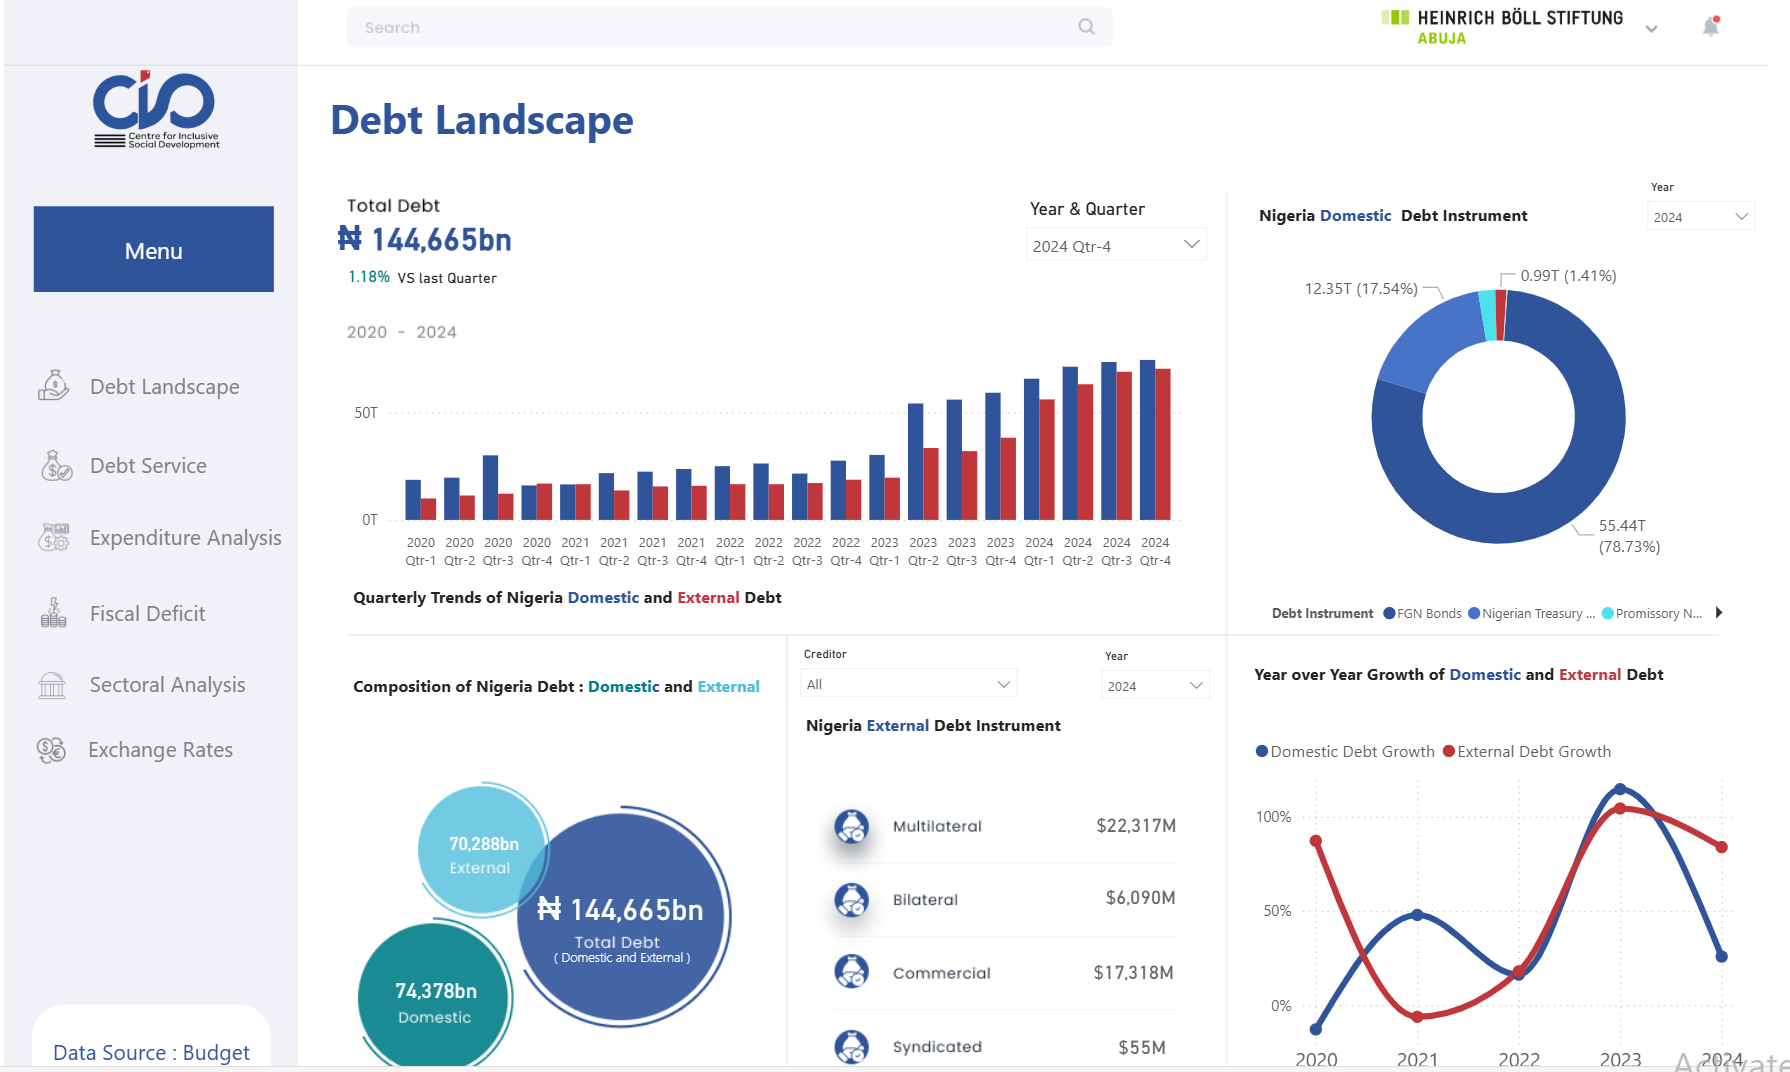
Debt Composition Analysis
Understand the breakdown between domestic and external debt, including currency exposure and creditor distribution across multilateral, bilateral, and commercial sources.
Temporal Trends
Track how Nigeria's debt has evolved over the past decade, identifying key inflection points, policy changes, and their impacts on borrowing patterns.
Debt Service Burden
Analyze the relationship between revenue generation and debt servicing costs, revealing the fiscal space available for critical development investments.
Comparative Analysis
Compare Nigeria's debt metrics against regional peers and international benchmarks to contextualize our fiscal position within the global economy.